Menus
Available in the Data Editor Window
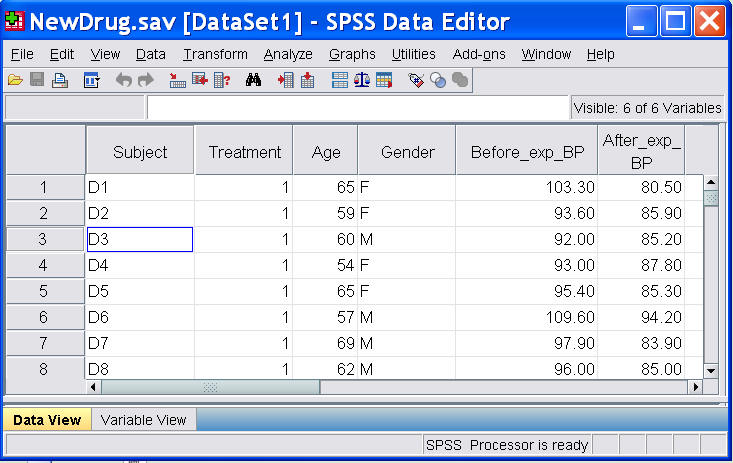
The data editor window is the default window
when you run SPSS. The data worksheet works just like a spreadsheet, where a column
represents a variable and a row represents a case or an observation. Many tasks in SPSS are performed by
selecting appropriate "Pull-down" menus.
The Data Editor Window looks as
follows:
Data Editor has two views:
 |
Data View, which is as
shown above. The data view worksheet works just like a spreadsheet,
where a column represents a variable and a row represents a case or an
observation. Many tasks in SPSS are performed by selecting appropriate
�Pull-down� menus. Cells in the data view contain data values. They do
not contain formulas as in some spreadsheet programs. Watch the
following movie clip to learn how to access the Data View and various
ways of reading data. |
 MOVIE: Reading SPSS,
Excel and Text Files
MOVIE: Reading SPSS,
Excel and Text Files
|
Variable View window: Click on 'Variable View'
shown at the bottom of the Data Editor, The variable view contains
descriptions of each variable attributes in the data file. The rows
contain the variables and the columns contain the variable attributes.
Variables can be deleted and the variable attributes can be modified.
Note that defining variable properties in variable view can also be
accomplished by using �Define Variable Properties� that is available on
the Data menu in the Data Editor Window. Watch the following movie clip
to learn how to use Variable View to edit variable attributes.
|
MOVIE:
Editing Variable Attributes
The menus in the Data Editor
window include:
| File:
To open an existing file, to read data (from a text data file or from an application [like
Excel] data file) into Data Editor window, to save a data file, and to exit SPSS for
Windows. The following movie clip demonstrates how to use some of the
menu items in File Menu for reading various types of data
|
MOVIE: Reading SPSS,
Excel and Text Files
| Edit:
To make changes like copy, cut or paste to the Data Editor window.
These functions work
just like a spreadsheet.
|
| Data:
To define variables, insert variables or cases, sort cases, merge files, split files,
select cases and use a variable to weight cases. The following two clips
demonstrate how to use the some of the menu items in the Data Menu for
sorting, merging and transposing data sets and for selecting subset of
cases and splitting files by variables.
MOVIE: Data Manipulation-Sort, Merge, Transpose
MOVIE: File
Manipulation; select, split
|
|
Transform: SPSS
can easily create new variables through variable transformation or
recoding the data values of an existing variable. The following clip
demonstrates how to compute a new transformed variable, recode data
values of an existing variable into a different variable or into the
same variable.
MOVIE: Transformation of
variables
|
|
Analyze: SPSS
provides an extensive list of statistical techniques for data analysis.
In a separate page,
Statistical Techniques,
we discuss many of these statistical techniques in details. The following
clip introduces the Analyze Menu and the basic sub-dialog common in any
statistical technique.
MOVIE: Statistical
Procedures
|
|
Graphs: To obtain high resolution plots and graphs, which can be edited in Chart Editor
window. SPSS provides various commonly used high resolution statistical
graphs. Go to Graphs Menu to choose the graphs that fits your need and
follow the dialog box to create your statistical graphs.
|
|
Utilities:
To run script and to display information on the contents of SPSS data files.
|
|
Add-Ons: SPSS
provides many other analytical techniques that are sold separately. If
your institution/company purchases some of these additional add-on
modules, you can run these techniques through the Add-Ons Menu. In this
workshop, we will demonstrate one of the menu items in the Utility Menu:
the Programmability Extension. Programmability Extension
allows users to integrate the R program into SPSS. This function is
available in SPSS 16.0 and latter versions. The following movie clip
demonstrates how to integrate R codes into SPSS. |
MOVIE: Programmability
Extension: Integrate R into SPSS
|
Window:
To move to an open window or to see which window is active. The window with a check
mark is the active one.
|
|
Help:
To get help on topics in SPSS and to ask the statistics coach some questions. This is a
very powerful tool. If you can not find enough information in the web workshop, you may be
able to find them in the Help system. |
After understanding the Data
Editor Window, you may want to learn about using SPSS for data manipulation,
including data input, sorting, merging, transformation and others. Details
are given in the page of
Manipulation of Data
|