SPSS consists of many statistical
procedures. All of these statistical procedures are under the Analyze menu. As
discussed in the Data Type and Possible Statistical
Techniques Section, different data types may require different statistical techniques. In this section, movie clips will be used to demonstrate some commonly used
statistical techniques available in SPSS.
For a general overview of
Statistical Procedures in SPSS, watch the movie clip:
 MOVIE: Statistical
Procedures
MOVIE: Statistical
Procedures
Submenus available under the
Analyze menu include:
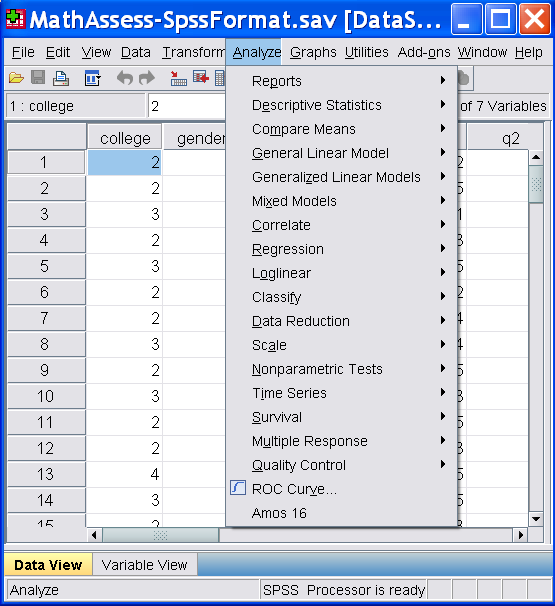
Clicking on each topic will take
you to the page discussing the techniques and the movie clips.
 | Descriptive
Statistics
includes frequencies, descriptives, explore, crosstabs, ratio, P-P plots
and Q-Q plots procedures.
|
| Compare
Means
includes
mean procedure, t-test procedure and one-way ANOVA.
|
| General
Linear Model
includes
univariate ANOVA procedures, multivariate (MANOVA) procedures, repeated
measures ANOVA, and variance components
analysis.
|
|
Generalized Linear Models
includes
generalized linear models and generalized estimating equations.
|
|
Mixed Models
procedure is an expansion of the general linear model, which allows data
to have correlated and non-constant variability (it
includes linear mixed models).
|
| Correlate
includes
bivariate and partial correlation, and distance measures.
|
|
Regression includes linear regression,
curve estimation, partial least squares, several types of logistic regression,
nonlinear models, two-stage least squares and optimal scaling
|
|
Loglinear Models includes
general loglinear model, logit and model selection.
|
|
Classification includes
two-step clustering, k-mean clustering, hierarchical clustering and discriminant analysis.
|
|
Data
Reduction includes factor analysis,
correspondence analysis and optimal scaling.
|
|
Scale gives reliability
analysis
and multidimensional scaling.
|
|
Nonparametric tests include runs, 1-sample K-S,
K independent samples, K related samples and others.
|
|
Time Series includes Time
series model creation and application, seasonal decomposition, spectral
analysis, autocorrelation and cross-correlation.
|
|
Survival Models includes
life table, Kaplan-Meier model, and Cox regression models.
|
|
Quality Control includes
control charts, Pareto charts and capability analysis.
|
|
ROC curve for model
comparison for categorical response.
|
|