SPSS On-Line Training Workshop

SPSS On-Line Training Workshop |
|
|
 In this Tutorial: |
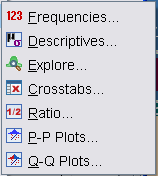
Descriptive statistical procedures consist of seven different types of analysis:
The following three movie clips demonstrate some of these tools:
|
In this on-line workshop, you will find many movie clips. Each movie clip will demonstrate some specific usage of SPSS.
This procedure gives frequency tables. It is usually used for categorical data. There are three submenus, which are:
Statistics: This submenu allows users to choose various descriptive measures such as average, median, standard deviation, percentiles, and so on | |
Charts: This submenu provides Bar charts and Pie charts for categorical data and histograms for quantitative data. | |
Format: This submenu allows users to define the format of the output. |
![]() Click
here to watch Frequencies and Descriptive
Click
here to watch Frequencies and Descriptive
This movie clip uses for this clip is the New Drug data set. See the Data Set page for details.
This is usually for continuous (as known as interval or scale) data. This procedure gives options of computing descriptive measurements such as mean, variance, standard deviation, and so on.
![]() Click
here to watch Frequencies and Descriptive
Click
here to watch Frequencies and Descriptive
The data set used for this clip is the New Drug data set. See the Data Set page for details.
This procedure gives several graphical presentation and descriptive measurements. This is a quick tool for checking some trivial data errors. It has three submenus:
Statistics: This submenu gives descriptive measurements that are also available in the Descriptive Procedure. One can request for outliers. | |
Plots: This submenu gives several graphical plots for any selected variable. These plots include stem-leaf plot, histogram and normality plot. They are useful for checking if a variable satisfies normality assumption for further analysis. | |
Options: This submenu allows users to decide how the missing data will be treated. |
![]() Click
here to watch Explore Procedures
Click
here to watch Explore Procedures
This data set used for this clip is the Disease data set. See the Data Set page for details.
This procedure is for exploring the relationship between two or more categorical variables in cross-tabulation form. This procedure has three or four submenus. If you have license for Exact Tests, this will be the fourth submenu. The submenus are
Statistics: This submenu allows you to do exact tests. | |
|
Statistics: This submenu provides many statistical tests that are used for categorical data analysis, including chi-squared test, Spearman correlation and many others. | |
Cells: This submenu allows users to choose the information to display in the output pivot tables. For example, expected counts, row percentage and column percentage can be requested. | |
Format: This submenu allows
users to choose the order of the category in the output. |
This data set used for this clip is the Tech Survey data set. See the Data Set page for details.
Ratio:
This procedure provides summary statistics (e.g. median, mean, weighted mean, standard deviation, concentration index) for describing the ratio between two scale variables. It has one submenu.
Probability Plots:
P-P and Q-Q probability plots are used to determine whether the distribution of a variable in the data matches a given distribution. If the variable matches a test distribution, the probability plots cluster around a straight line. The test distributions include uniform, normal, Student’s t, gamma and beta. The P-P procedure plots a variable’s cumulative proportions (or empirical cumulative distribution function) against the cumulative proportions of a test distribution. The Q-Q procedure plots the quantiles of a variable’s distribution against the quantiles of a test distribution.
![]()
![]()
This online SPSS Training Workshop is developed by Dr Carl Lee, Dr Felix Famoye , student assistants Barbara Shelden and Albert Brown , Department of Mathematics, Central Michigan University. All rights reserved.