SPSS On-Line Training Workshop

SPSS On-Line Training Workshop |
|
|
 In this Tutorial: |
Three movie clips are created to demonstrate some of these techniques:
Back to Statistical Procedures
|
In this on-line workshop, you will find many movie clips. Each movie clip will demonstrate some specific usage of SPSS.
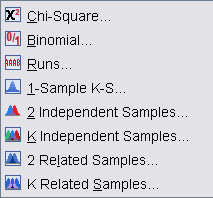
Chi-square: This is a goodness of fit test which is used to compare observed and expected frequencies in each category. If you have Exact Test license, you can perform exact test when the sample size is small. Under “Options” submenu, you can request for descriptive statistics and specify how to handle missing values.
Binomial Test: This is used to compare the observed and expected frequencies under a binomial distribution with a specified parameter. By default, the hypothesized proportion is 0.5 and this can be changed. The procedure has both “Exact” and “Option” submenus. If you have Exact Test license, you can perform exact test when the sample size is small by clicking on the “Exact” submenu. Under “Options” submenu, you can request for descriptive statistics and specify how to handle missing values.
Runs: This technique is used when you want to test for randomness. The procedure has “Option” submenu and “Exact” submenu if you have license for Exact Test.
Cut point- This is the value that you choose (median, mode, mean, other) to divide the variable into two separate groups.
Exact- You can perform exact test when the sample size is small. | |
Options- If you want descriptive statistics for your variable, you must choose this. |
![]() Click
here to watch Nonparametric Runs
Click
here to watch Nonparametric Runs
The data set used for this demonstration is the Cancer data set. See the Data Set page for details of the data. The question that we would like to answer is whether age is random.
1-Sample K-S: This is used to test if the variable has a specified distribution. The procedure has “Option” submenu and “Exact” submenu if you have license for Exact Test.
Test Distribution- We must choose from the four tests listed:
|
Normal- compare a distribution to the Normal distribution | |
|
Poisson- compare a distribution to the Poisson distribution | |
|
Uniform- compare a distribution to the Uniform distribution | |
|
Exponential- compare a distribution to the Exponential distribution |
The submenus are:
Exact- You can perform exact test when the sample size is small. | |
|
Options- If we want descriptive statistics for our variable, we must choose this. |
![]() Click
here to watch Nonparametric Runs
Click
here to watch Nonparametric Runs
The data set used for this demonstration is the Cancer data set. See the Data Set page for details of the data. The question that we would like to answer is whether age follows a normal distribution.
2 Independent Samples: This technique is similar to the independent t-test, but does not require the assumption of normal distribution. The procedure has “Option” submenu and “Exact” submenu if you have license for Exact Test.
Test Type- Mann-Whitney is the default and is the most common. If you want to test for both location and shapes, you would choose the Kolmogorov-Smirnov or the Wald-Wolfowitz.
The submenus are:
|
Exact- You can perform exact test when the sample size is small. | |
|
Options- If we want descriptive statistics for our variable, we must choose this. |
![]() Click
here to watch Nonparametric Independent Samples
Click
here to watch Nonparametric Independent Samples
The data set used for this demonstration is the Food Company data set. See the Data Set page for details of the data. The dependent variable is Sales and independent or factor variable is Design. The purpose is to test if sales are different between the store Design 1 and Design 2.
K Independent Samples: This method is similar to ANOVA, but does not require the normality assumption. This is for comparing two or more independent groups on one variable. The procedure has “Option” submenu and “Exact” submenu if you have license for Exact Test.
Test type- Kruskal-Wallis is the default, and is one of the most popular tests.
The submenus are:
|
Exact- You can perform exact test when the sample size is small. | |
|
Options- If we want descriptive statistics for our variable, we must choose this. |
![]() Click
here to watch Nonparametric Independent Samples
Click
here to watch Nonparametric Independent Samples
The data set used for this demonstration is the Food Company data set. See the Data Set page for details of the data. The dependent variable is Sales and independent or factor variable is Design. The purpose is to test if sales are different among four store designs.
2 Related Samples: This technique is similar to the paired t-test, but does not require the normality assumption. When you have polytomous data, use the Marginal homogeneity test. This option is available if you have the Exact Test license. The procedure has “Option” submenu and “Exact” submenu if you have license for Exact Test.
Test type- Wilcoxon and Sign are for continuous data. Wilcoxon is more powerful. If you have binary data, the McNemar test is the test to choose.
![]() Click
here to watch Nonparametric Related Samples
Click
here to watch Nonparametric Related Samples
The data set used for this demonstration is the Cancer data set. See the Data Set page for details of the data. The treatment factor has two levels: 0 represents the placebo group and 1 represents the treatment group. The response variables are the oral condition ratings observed at the initial stage, and at the end of weeks 2, 4 and 6. The larger the rating, the better the condition. For this demonstration, analysis of two related variables, we will compare the ratings at the end of week 2 and week 4.
K Related Samples: This method is similar to the repeated measures ANOVA, but does not require the normality assumption. The procedure has “Statistics” submenu and “Exact” submenu if you have license for Exact Test.
Test Type- Friedman's is a popular test. Kendall's is a normalization of the Friedman test. Cochran's is used for binary data.
The submenus are:
Exact- You can perform exact test when the sample size is small. | |
|
Statistics- If you want descriptive statistics for your variable, you must choose this. |
![]() Click
here to watch Nonparametric Related Samples
Click
here to watch Nonparametric Related Samples
The data set used for this demonstration is the Cancer data set. See the Data Set page for details of the data. The treatment factor has two levels: 0 represents the placebo group and 1 represents the treatment group. The response variables are the oral condition ratings observed at the initial stage, and at the end of weeks 2, 4 and 6. The larger the rating, the better the condition. For this demonstration, analysis of K related variables, we will compare the ratings between the four stages: initial stage, end of weeks 2, 4 and 6.
![]()
![]()
This online SPSS Training Workshop is developed by Dr Carl Lee, Dr Felix Famoye , student assistants Barbara Shelden and Albert Brown , Department of Mathematics, Central Michigan University. All rights reserved.